Node Image
Node Image
In the graphical interface, the node is generally expressed to an icon and text label, where the icon is the main part of node, and the text label is the auxiliary component. The main part not only supports the icon (static image) but also supports Canvas code, GIF animation, SVG and vector graph (Q.Path) etc.
Set node graph:
Q.Node#image - main part of node
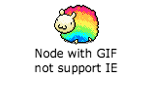
Example Set GIF icon as the main part of node
var nodeWithGIF = graph.createNode("Node with GIF\nnot support IE", 120, 110);
nodeWithGIF.image = "./images/sheep.gif";
Operation effect:
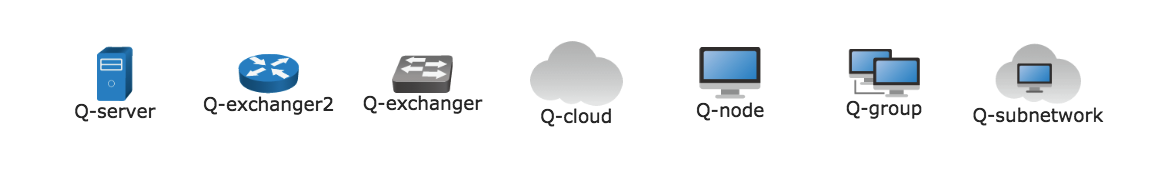
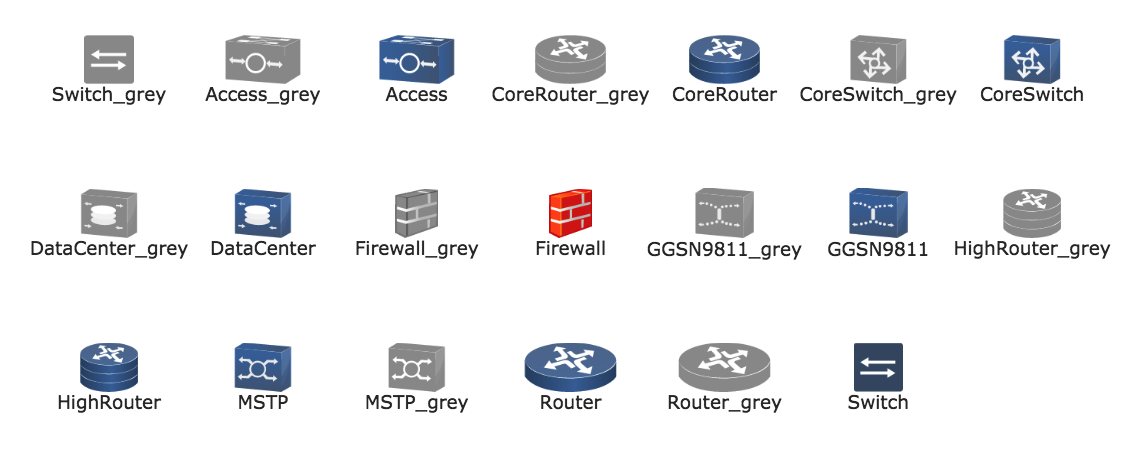
Built-in icon
All built-in icons of Qunee are showed hereinafter. The Canvas code is used, with ‘Q-’ as prefix of name
var graph = new Q.Graph('canvas');
graph.moveToCenter();

var images = Q.getAllImages();
var x = 0, y = 0;
images.forEach(function(image){
    graph.createNode(image, x, y).image = image;
    x += 100;
})
Operation effect is as follows
Canvas code icon - recommended
Qunee recommends to use Canvas code as the icon, with two advantages: support vector; synchronized load.
Qunee built-in icons are applied with this method.
Let’s see how to make this kind of graph from following examples
Make Canvas code icon
Make Canvas code icon by SVG2Canvas
1. Make SVG icon
Firstly the art designer uses Adobe Illustrator (AI) or similar tools to make vector icons, and export files in SVG format
2. SVG converted to Canvas code
Use Chrome or Safari browser. Visit SVG2Canvas - http://demo.qunee.com/svg2canvas/. Drag SVG file to left dotted line frame. After a while, you may see generated Canvas code at the right text box. The central bottom shows the effect that these codes are used as node icons
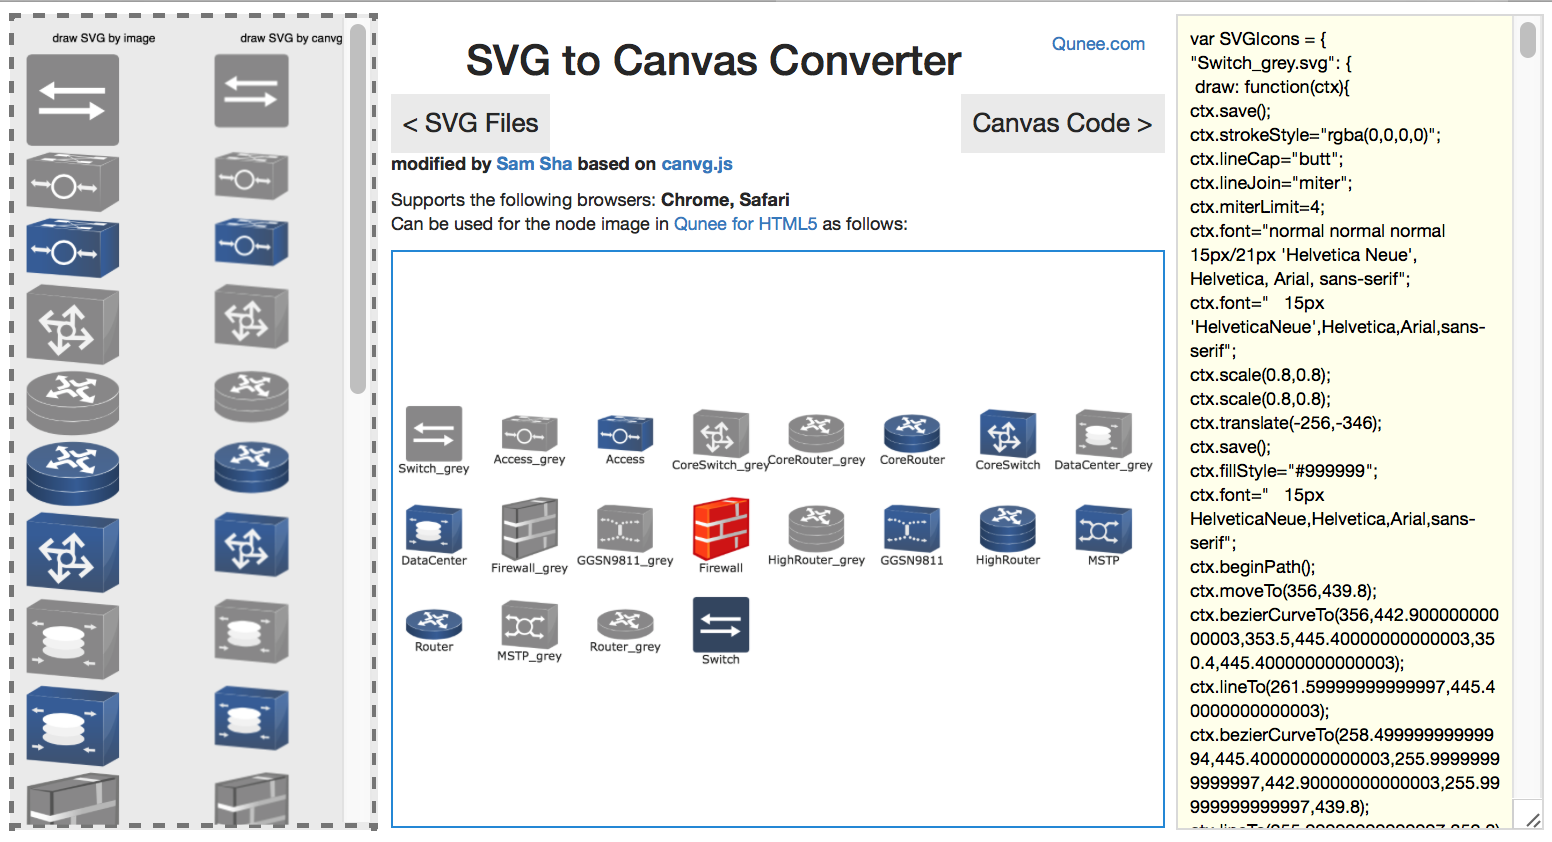
Generated code structure and usage
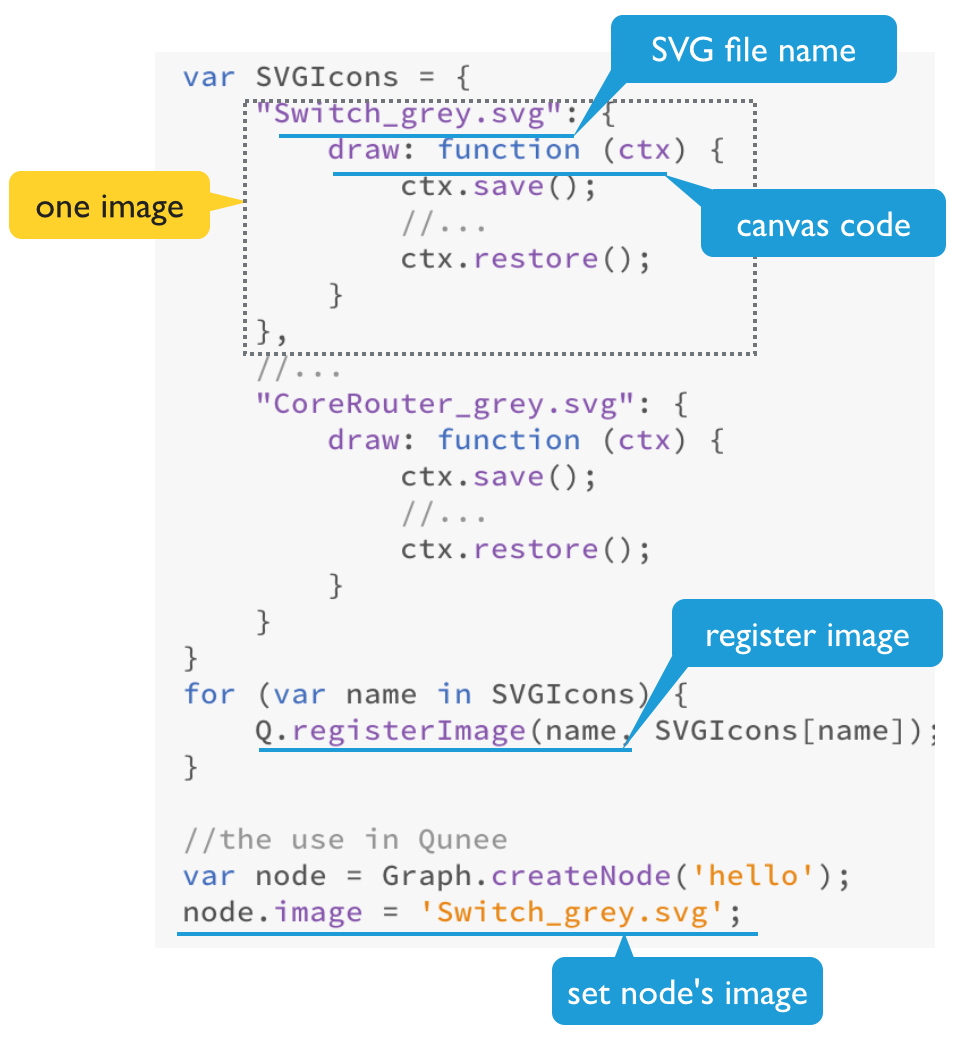
3. Usage in Qunee
Save generated code in the text box to js file, such as SVGIcons.js, and input from html file. For example:
<body style="margin: 0px">
<div style="position: absolute; width: 100%; top: 0px; bottom: 0px;" id="canvas"></div>
<script src="http://demo.qunee.com/lib/qunee-min.js"></script>
<script src="SVGIcons.js"></script>
<script>
    var graph = new Q.Graph('canvas');
    graph.moveToCenter();

var x = 0, y = 0;
    for(var name in SVGIcons){
        var node = graph.createNode(name.substring(0, name.indexOf('.svg')), x, y);
        node.image = name;
//        node.setStyle(Q.Styles.RENDER_COLOR, Q.randomColor())
        x += 100;
        if(x > 600){
            x = 0;
            y += 100;
        }
    }
</script>
</body>
Operation effect
Use SVG Vector Image
To make icons by SVG will realize perfect vector effect, without distortion to zooming
Pay attention that in IE explorer, you can draw SVG images in Canvas,
but unable to acquire pixel information of SVG, and thus it is unable to
make image dyeing, also unable to seek node edge. So Qunee recommends to
use SVG file only after converting the SVG file to Canvas
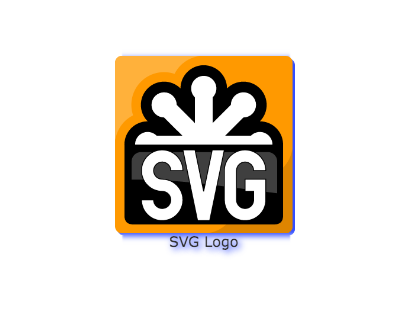
Example
var graph = new Q.Graph("canvas");
var svg = graph.createNode("SVG Logo");
svg.image = 'SVG_logo.svg';
Operation effect
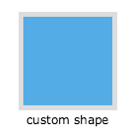
Draw custom-made icon
Support full custom-made icons. 2D function may be applied for drawing desired effect
Example, set the custom-made icon as the main part of node
var customDraw = {
    width: 100,
    height: 100,
    draw: function (g, scale) {
        g.beginPath();
        g.rect(0, 0, 100, 100);
        g.fillStyle = Q.toColor(0xCC2898E0);
        g.fill();
        g.lineWidth = 10;
        g.strokeStyle = '#DDD';
        g.stroke();
    }
}
var node = graph.createNode("custom shape");
node.image = customDraw;
Operating interface:
Shape Icon
The path may be used as the main part of node. By multi-control points, draw the shape and scope of node Example
Custom-made path as the main part of node
var nodeShape = graph.createNode("Custom Shape", 240, 110);
var customShape = new Q.Path();
customShape.moveTo(20, -50);
customShape.lineTo(100, -50);
customShape.lineTo(100, 50);
customShape.quadTo(20, 50, 20, 20);
nodeShape.image = customShape;
nodeShape.setStyle(Q.Styles.SHAPE_STROKE, 4);
nodeShape.setStyle(Q.Styles.SHAPE_STROKE_STYLE, Colors.blue);
nodeShape.setStyle(Q.Styles.LAYOUT_BY_PATH, true);
nodeShape.size = {width: 100, height: -1};
Operating interface:
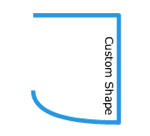
Image size
Set the image size. Support zooming as per certain ratio. For vector image, adjust the image size that will not lead to distortion of image. And for grid images, it can be clearly showed.
#size - size, used to set the size of node image. If only width is set, the height will be zoomed as per equal ratio
Icon
Select HD images for nodes. Then set smaller size. When interface zooming can be realized, the image will still be clear, such as selecting images at pixel width of 256. Set the node size to 64. When the interface is zoom in four times, the image is still clear
Example
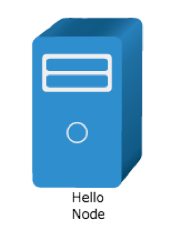
Set the node name, vector icon, and assign width to 100, and zoom in as per equal ratio:
var hello = graph.createNode("Hello\nNode");
hello.image = Q.Graphs.server;
hello.size = {width: 100};
Presentation: