Edge Appearance
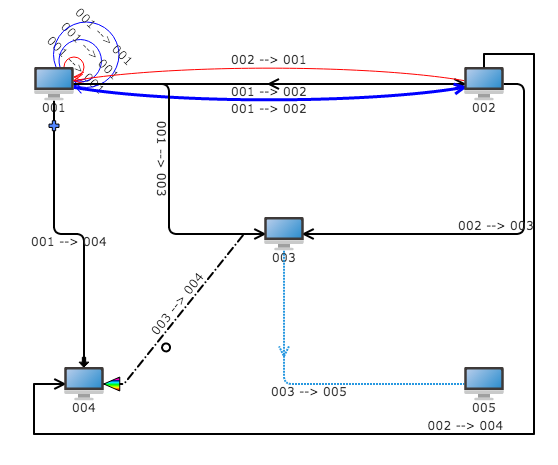
Thickness, color and line style of edge can be set. Supports arrow. Various trend, and child components on edge (including text labe) can be distributed along the line. More edges can be displayed at the same time between two nodes. Supports looped effect of edge.
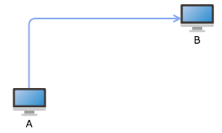
Example for setting edge appearance
Sets width, color and type of edge
var a = graph.createNode("A", -100, 50);
var b = graph.createNode("B", 100, -50);
var edge = graph.createEdge(a, b);
edge.setStyle(Q.Styles.EDGE_COLOR, '#88AAEE');
edge.setStyle(Q.Styles.EDGE_WIDTH, 2);
edge.edgeType = Q.Consts.EDGE_TYPE_VERTICAL_HORIZONTAL;
Operating interface:
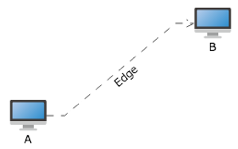
Example of dotted line style of edge
Set dotted line style of edge
var a = graph.createNode("A", -100, 50);
var b = graph.createNode("B", 100, -50);
var edge1 = graph.createEdge(a, b, 'Edge');
edge1.edgeType = Q.Consts.EDGE_TYPE_ELBOW;
edge1.setStyle(Q.Styles.EDGE_LINE_DASH, [8, 4, 0.01, 4]);
edge1.setStyle(Q.Styles.LINE_CAP, "round");
Operating interface:
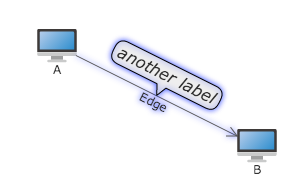
Multi text label of edge
The edge can be set with several text label to show different information
Example
Adds one text label on the edge
var graph = new Q.Graph('canvas');
var A = graph.createNode("A", -100, -100);
var B = graph.createNode("B", 100, 0);
var edge = graph.createEdge("Edge", A, B);
var label2 = new Q.LabelUI();
label2.position = Q.Position.CENTER_TOP;
label2.anchorPosition = Q.Position.CENTER_BOTTOM;
label2.border = 1;
label2.padding = new Q.Insets(2, 5);
label2.showPointer = true;
label2.offsetY = -10;
label2.backgroundColor = "#EEE";
label2.fontSize = 16;
label2.fontStyle = "italic 100";
edge.addUI(label2, [{
    property : "label2",
    propertyType : Q.Consts.PROPERTY_TYPE_CLIENT,
    bindingProperty : "data"
}, {
    property : "label2.color",
    propertyType : Q.Consts.PROPERTY_TYPE_CLIENT,
    bindingProperty : "color"
}]);
edge.set("label2", "another label");
Operation effect