Using HTML5 technology,draw clean and smooth network diagrams which can be used as social network diagram, topologic graph, flow chart and map, etc; JS component encapsulation; convey complex concept in a simple way; easily build up elegant internet application and enterprise application; make the online visualization of data much easier
Qunee - pronunciation: “kjuːni”; means elegant and light; conforms with our attitude to product details and user experience
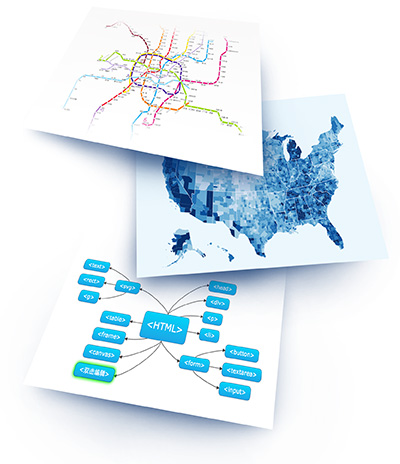
Qunee provides a great many vector graphs, and displays point data and wiring data and it applies to metro and pipeline application
Qunee supports roaming interaction, infinite zoom and unlimited coordinate range,which suitable for presenting maps. And rich style of polygon, it could solve many problems with map background and statistic maps
Qunee supports different types of pixel style, such as node, wiring and grouping, and is good at layer control; it also supports thousands of graphic elements and smooth operation which bring fluent and efficient visual experience; it solves network data's displaying or interating problem
With the help of the powerful tree layout editor,Qunee could solve the problem of the automatic layout of tree structure data,and can be used in organization chart or mind mapping, etc.
Qunee offers plenty of basic graphic and arrow patterns,supports different kinds of wiring type, including curve and orthogonality,and controls the inclusive relationship. Thus it could solve the problem with flow chart.
Qunee for HTML5 uses JavaScript to develop. Through importing quee-min.js documents and writing simple code, the client could develop topological graphs easily.
<!DOCTYPE html>
<html>
<body>
<div style="height: 500px;" id="canvas"/>
<script type="module">
    import Q from 'http://demo.qunee.com/lib/qunee-es.js';
    let graph = new Q.Graph('canvas');

    let hello = graph.createNode('Hello', 0, -50);
    hello.image = Q.Graphs.server;
    let qunee = graph.createNode("Qunee", 100, 50);
    let edge = graph.createEdge("Hello\nQunee", hello, qunee);
    edge.setStyle(Q.Styles.LABEL_COLOR, '#F00');
</script>
</body>
</html>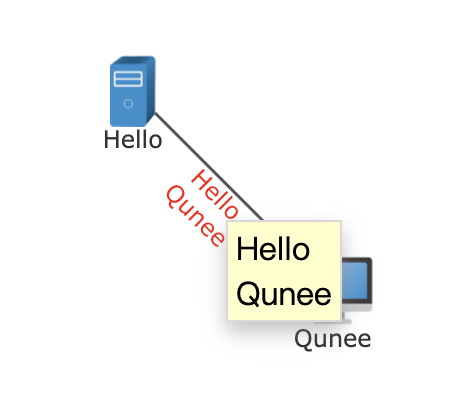

To achieve rich client application, plug-in technology, such as Adobe Flash, Microsoft Silverlight, and Java Applet was needed,which has some problems (plugins needed, or incompatible with mobile platform). By contrast, the advantages of HTML5 are:
With the development of technology,major browsers support the HTML5 in a more and more perfect way.The web page is no longer just displaying text or images. Using a combination of HTML5 technology could achieve more functions:Real-time communication、local storage、 graphic plotting,With the help of Canvas,SVG and CSS3, HTML 5 could creat rich types of graphical interface and animations
With the technical support, it is possible to display professional graphic components in a website.Qunee for HTML5 The use of HTML5,could turn this possibility to reality; it reduces the technical barriers,making efficient 、 rich、and dynamic graphical display easier
If you have any question,please contact
Email: support#qunee.com